Highly multiplexed immunofluorescence imaging of human tissues and tumors using t-CyCIF and conventional optical microscopes
Lin JR, Izar B, Wang S, Yapp C, Mei S, Shah P, Santagata S, Sorger PK.
eLife. 2018 Jul 11;7:e31657. PMID: 29993362
Publication summary
Available images
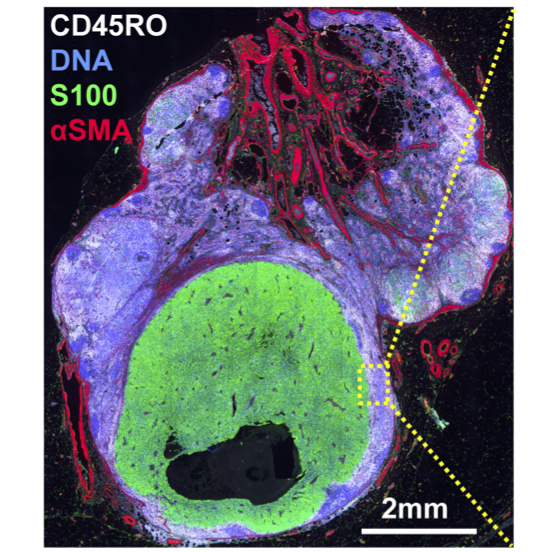
Figure 2
Representative t-CyCIF staining of a large metastatic melanoma lesion and adjacent benign tissue stitched together using the Ashlar software from 165 successive CyteFinder fields using a 20X/0.8NA objective.
Melanoma mosaic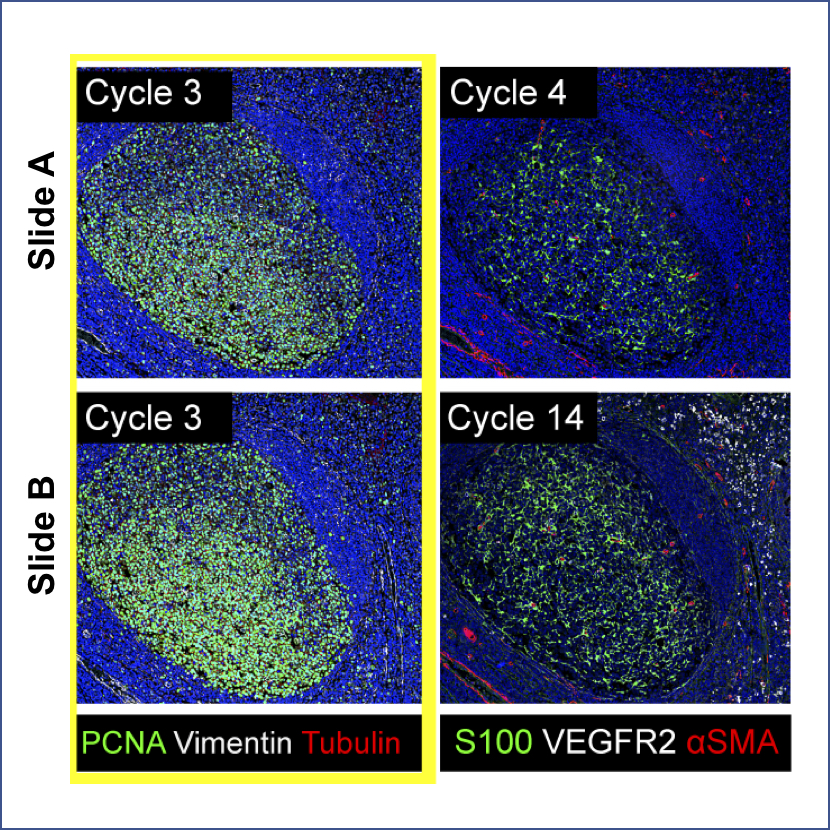
Figure 5 and 6
Representative images of Slide A (top panels) and Slide B specimens (bottom panels) after each t-CyCIF cycle. The color coding highlighting specific cycles is the same as in A.
Tonsil A mossaic Tonsil B mossaic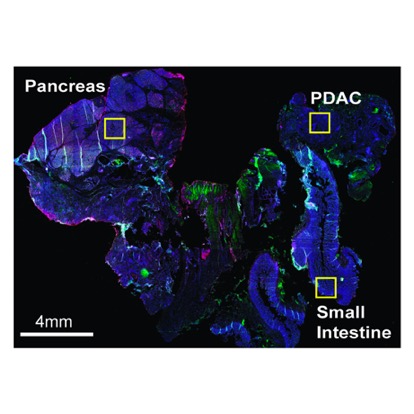
Figure 7 and 8
t-CyCIF of a large resection specimen from a patient with pancreatic cancer. The entire sample comprising 143 stitched 10X fields of view is shown.
PDAC mosaic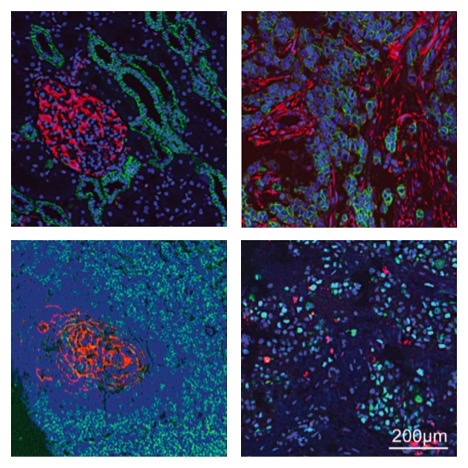
Figure 10
Eight-cycle t-CyCIF of a tissue microarray (TMA) including 13 normal tissues and corresponding tumor types. The TMA includes normal tissue types, and corresponding high and low grade tumors, for a total of 39 specimens.
TMA mosaic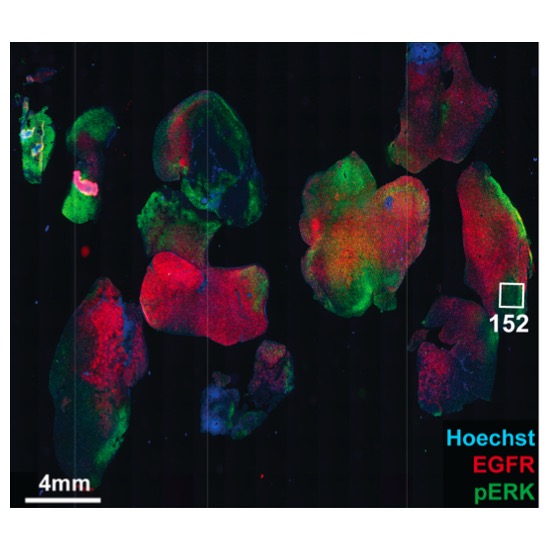
Figure 11 and 12
Molecular heterogeneity in a single GBM tumor. (A) Representative low magnification image of a GBM specimen generated from 221 stitched 10X frames; the sample was subjected to 10 rounds of t-CyCIF.
GBM mosaic